Flutter Dev Tools — Network Debugging for iOS
3 min readMar 10, 2023
Overview
This page will help developers to debug network requests from flutter app using chrome wen browser.
Below are my configurations
- IDE — VSCode
- Platform — iOS
- Web Browser — Google Chrome
Attach
First, let’s attach the flutter app to a simulator
Step 1
- Attach to flutter process, by pressing
CMD + Shift + P
Step 2
- Just press enter here

Step 3
- Wait for the connection to be established

Step 4
- Launch your app in simulator (if you want to debug native iOS then launch by starting Cmd+R in Xcode)
- Simply open the app in simulator
Step 5
- Flutter will sync files 😍

In your debug console you will see a server address, have it copied ✅

Step 5
- That’s it now once you have seen the dialog, you are now ready to debug.
- Just click on the Hot-restart to initiate a debug session

Network Debugging
Two ways to do debug network calls from your flutter application
- Using built in Dev tools network page in your IDE (VSCode)
- Using Google chrome network page
1. Using built in Dev tools network page in your IDE (VSCode)
Press
CMD + Shift + PChoose

That’s it

2. Using Google chrome network page
- Running below command will will start dev tools in Chrome web browser
pub global run devtools- If you do not have dev tools installed, install it by following the steps here — https://docs.flutter.dev/development/tools/devtools/cli

- Open chrome and paste the address that you copied in Step 4 on to the Connect to a running app text field and press connect
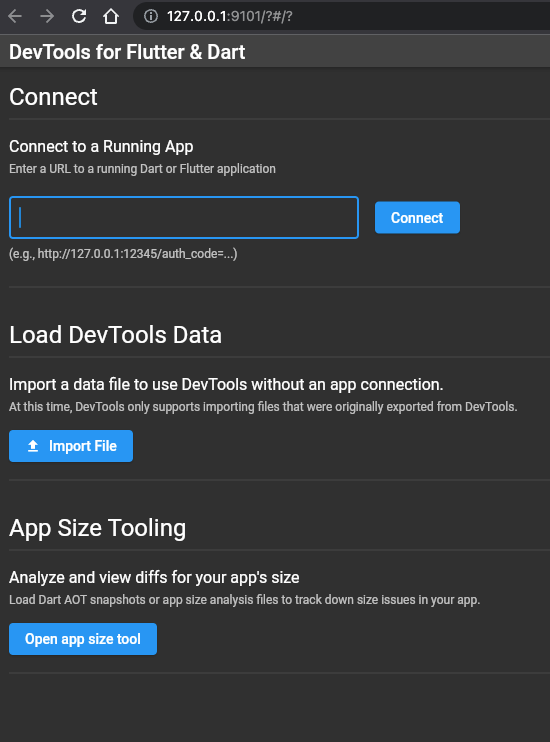
That’s it you can now debug your flutter application - network, performance, widgets and so many other aspects of your flutter app 🚀